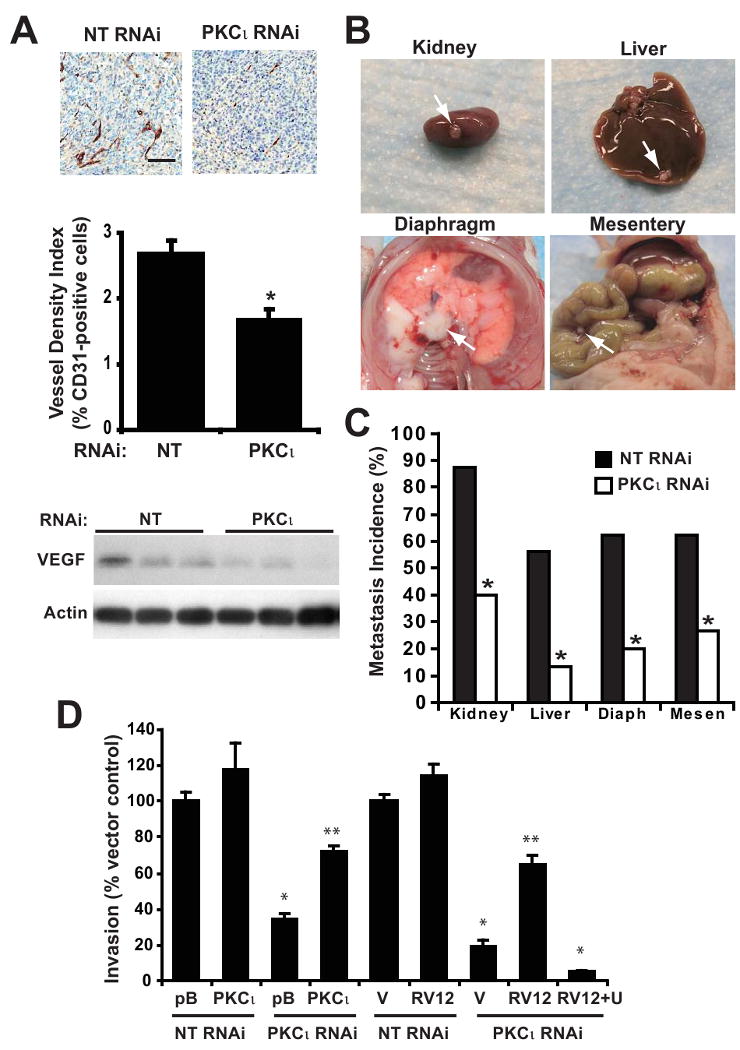
Figure 6. Inhibition of PKCι blocks PDAC angiogenesis and metastasis.

A) Top: Immunohistochemical detection of CD31 staining. Bar=100μm. Middle: Quantitative analysis of CD31 positive staining in Panc-1 tumors, calculated as the ratio of CD31-positive pixels to the sum of all pixels. Mean+/-SEM is plotted. Bottom: Representative immunoblot analysis of VEGF and actin in Panc-1 NT and PKCι RNAi orthotopic pancreatic tumors. B) Representative images of tumor metastases to various organs. C) Percent of orthotopic Panc-1 NT and PKCι RNAi pancreatic tumors that metastasized to various organs is plotted. *= significantly different than NT RNAi tumors. D) Panc-1 cells were assayed for cellular invasion through Matrigel-coated chambers as described in Materials and Methods. pB=pBABE control vector; V=LZRS control vector; RV12= RacV12; RV12+U= RacV12 treated with 10 μM U1026; *= significantly different than control (NT & pB) or (NT & V), **= significantly different than (PKCι RNAi & pB) or (PKCι RNAi & V) or (PKCι RNAi & RV12 +U). Mean +/-SEM is plotted and represents two independent experiments.
