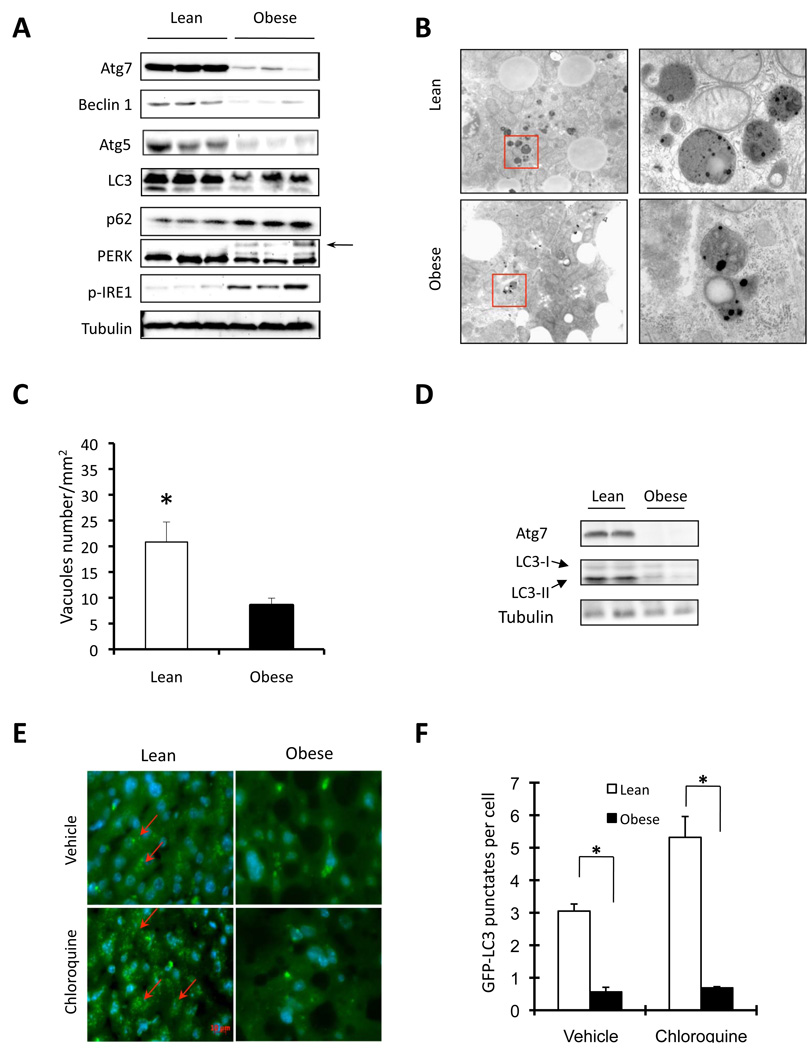
Figure 1. Regulation of autophagy in obesity.
A. Autophagy and ER stress indicators were examined in liver tissue of obese (ob/ob) mice and age-and sex-matched lean controls by western blot analysis. Autophagy was evaluated by the conversion of LC3-I to LC3-II, expression of Beclin 1, Atg5, Atg7, and p62 proteins as markers. ER stress was examined by the phosphorylation of IRE1 and PERK (the arrow indicates phosphorylated PERK). B. Representative electron micrographs (9690×) of livers of lean and obese mice. The pictures shown on the right are high magnification (57800×) of the field marked with a red rectangle on the left panel. C. Quantification of autophagolysosome-like vacuoles per field in the EM images. D. Examination of autophagic markers in the liver of obese mice and its age-and sex-matched lean control after food withdrawal. E. Representative pictures of GFP-LC3 punctate structures in livers of lean and obese mice expressing GFP-LC3, in the presence or absence of chloroquine. The red arrows indicate the GFP-LC3 punctate structure; the nuclei were stained with DAPI shown in blue. F. Quantification of GFP-LC3 punctate structure per cell. Data are shown as mean ± SEM. Asterisk indicates statistical significance determined by student’s t test (*p<0.05). All mice are male and at the age of 12–16 weeks.

