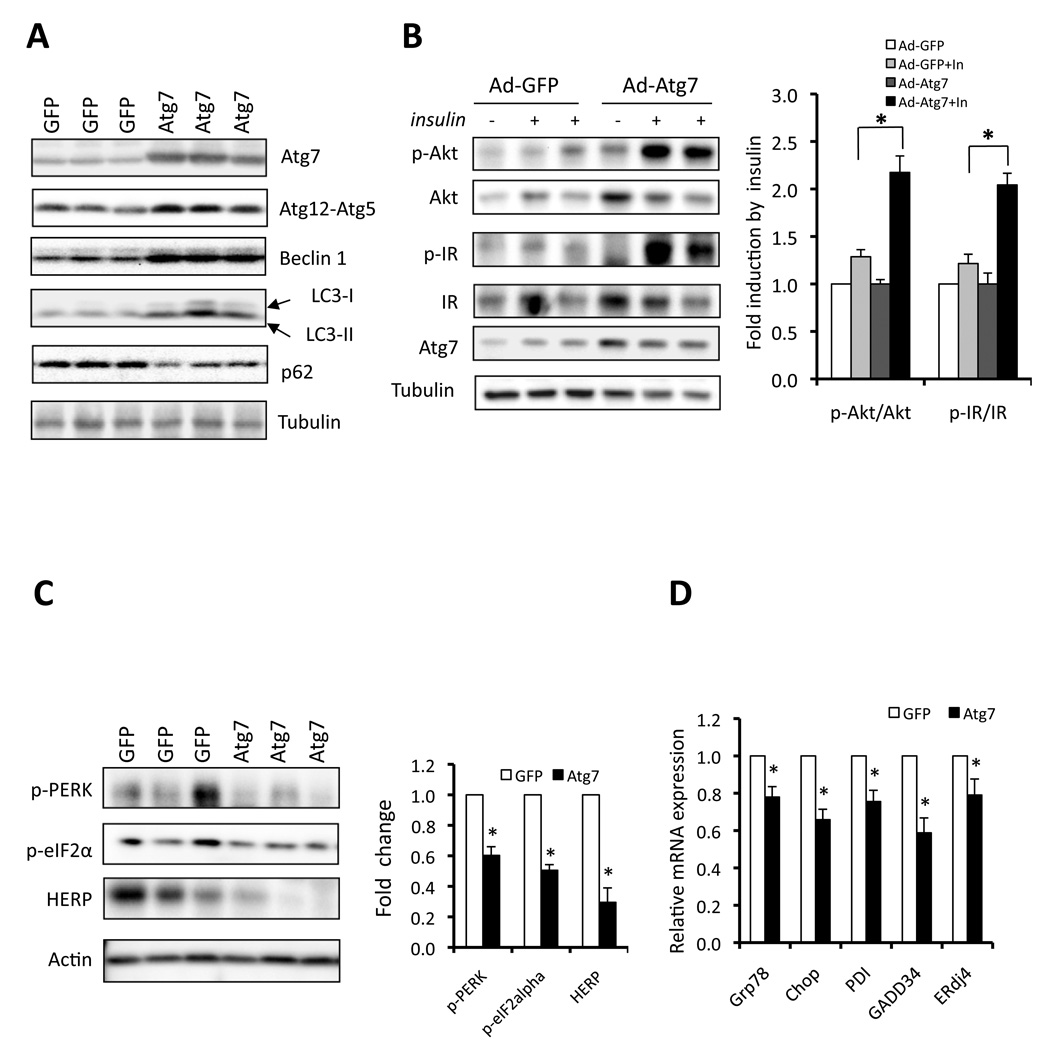
Figure 5. Restoration of autophagy and improvement of insulin action by reconstitution of Atg7 in obese mice.
A. Autophagy in ob/ob mice following adenoviral expression of Atg7 or control vector (GFP). Atg7, Atg12-Atg5 conjugation, Beclin 1 expression, LC3 conversion and p62 levels were examined as autophagy markers. B. Insulin-stimulated IR tyrosine 1162/1163 (p-IR) and Akt serine 473 (p-Akt) phosphorylationin the livers of ob/ob mice expressing Atg7 or control vector (GFP). Atg7 and tubulin are used as controls. Quantification of the data is shown in right panel. Results represent fold induction by insulin compared to basal levels in each group. C. Phosphorylation of PERK, eIF2α and expression of HERP proteins in the livers of ob/ob mice expressing Atg7 or control (GFP) proteins by adenoviral delivery. Actin is shown as a control and quantification of the data is shown in right panel. Results represent fold change in each molecule by Ad-Atg7 to Ad-GFP. D. mRNAs coding for Grp78, Chop, PDI, Gadd34 and ERdi4 were examined by quantitative RT-PCR in livers of ob/ob mice reconstituted with Atg7. Results are presented as gene expression levels in Atg7 group normalized to controls (GFP). All data are shown as mean±SEM. Asterisk indicates statistical significance determined by student’s t test (*p<0.05).

