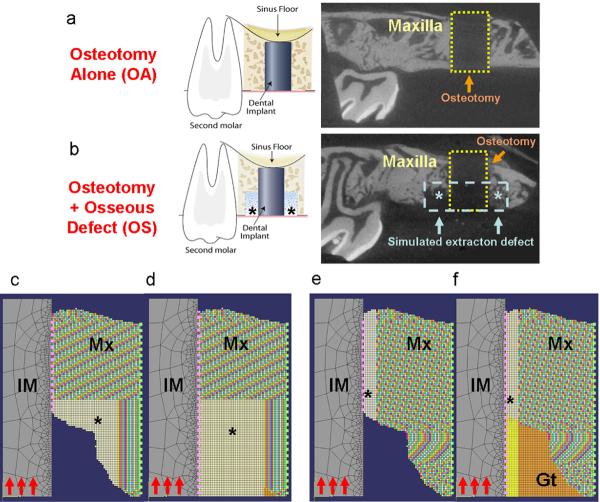
Figure 1. In vivo dental implant osseointegration model for functional simulations.
The surgical model of osteotomy-alone and osseous-defect group are demonstrated in the left panels of (a, b). The right panels demonstrate a slice of micro-CT image from a 10-day specimen after implant removal (the 1×2mm area of osteotomy is marked by the yellow dashed line; the 0.6×1 mm area of simulated extraction defect is marked by blue dash line and asterisks). The optimized FE models are shown on (c) FBAM and (d) FCAM for evaluation of osseous wound repair, (e) FBAM and (f) FCAM of interfacial tissue for evaluating the correlation to interfacial biomechanics. Suspended boundary (dash lines in light green) was assumed, and the bone-implant interface (dash lines in pink) was assumed homogenous and simulated using cohesive elements. In each model, the Young's modulus of the mineralized tissue (Mx) was projected from the grayscale of micro-CT images, whereas the dental implant (IM) and granulation tissue (Gt) was obtained from a reference standard29–32. The Young's modulus of the bone or tissue in the area of interest (asterisk) was calculated from the functional loading from the oral cavity (red arrows). The elasticity of interface was assumed equivalent to the peri-implant element nearby. Osteotomy-alone (OA) and osteotomy with osseous defect (OS) specimens were examined for each simulation (n=12–14 for each group).
Abbreviations: FE: finite element; FBAM: functional bone apparent modulus; FCAM: functional composite tissue apparent modulus

