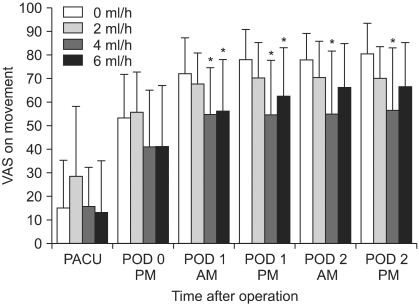
Fig. 5.
This diagram compares the VAS pain scores on movement in the four groups. The VAS scores on movement in the 4 ml/h group are significantly lower than the control on PODs 1 and 2, but only on POD 1 in 6 ml/h. VAS: visual analog scale, PACU: postanesthesia care unit, POD: postoperative day. *P < 0.05 compared to the 0 ml/h group.

