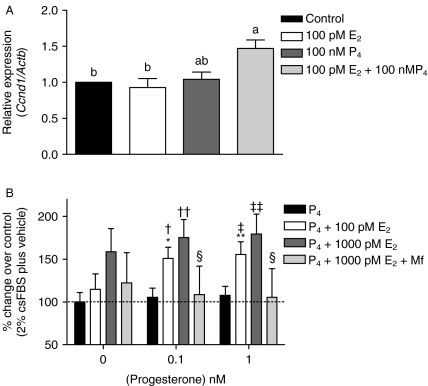
Figure 5.
Effects of E2, P4, and their combinations on cell proliferation and signaling in primary mouse pituitary cells and rat somatomammotroph GH3 cells. (A) Expression of Ccnd1 mRNA in primary pituitary cells isolated from 5-month-old TG mice and stimulated for 24 h as indicated. The results are mean±s.e.m. of five individual experiments. Different letters indicate significant differences (P<0.05) between the treatment groups. (B) Effects of 48 h P4 stimulation on GH3 cell proliferation when co-treated with E2 and/or mifepristone (Mf). The mean cell number in controls was taken as 100%, and those of the other treatments were related to this figure (mean±s.e.m. of 5–6 independent experiments). *P<0.05, **P<0.01 versus basal plus 100 pM E2; †P<0.05, ††P<0.01 vs 0.1 nM P4; ‡P<0.05, ‡‡P<0.01 vs 1 nM P4; §P<0.01 vs 0.1 and 1 nM P4+1000 pM E2+10 μM Mf.

