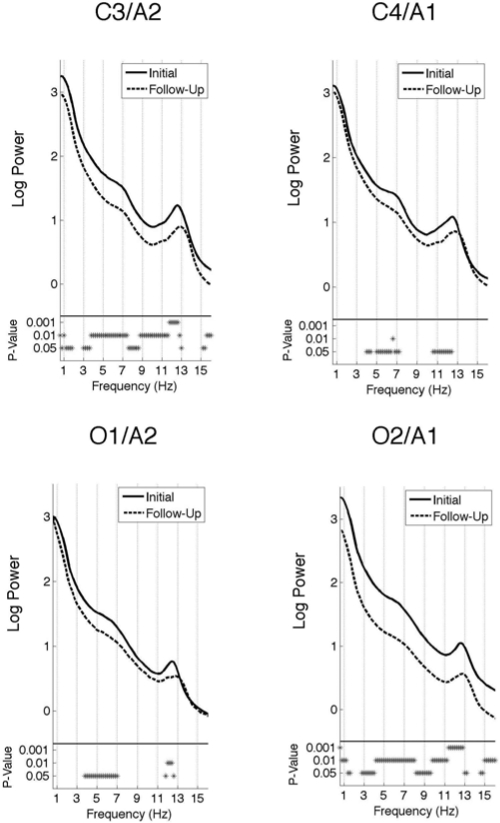
Figure 2.
All-night spectra: Subject average NREM sleep spectra of the log power at two central (C3/A2 and C4/A1) and two occipital (O1/A2 and O2/A1) electrodes. The spectra at the initial recording session is plotted as a solid line and the follow-up session as a dashed line. The frequency resolution of these plots is 0.2 Hz. The P-values are indicated by asterisks below the spectra.

