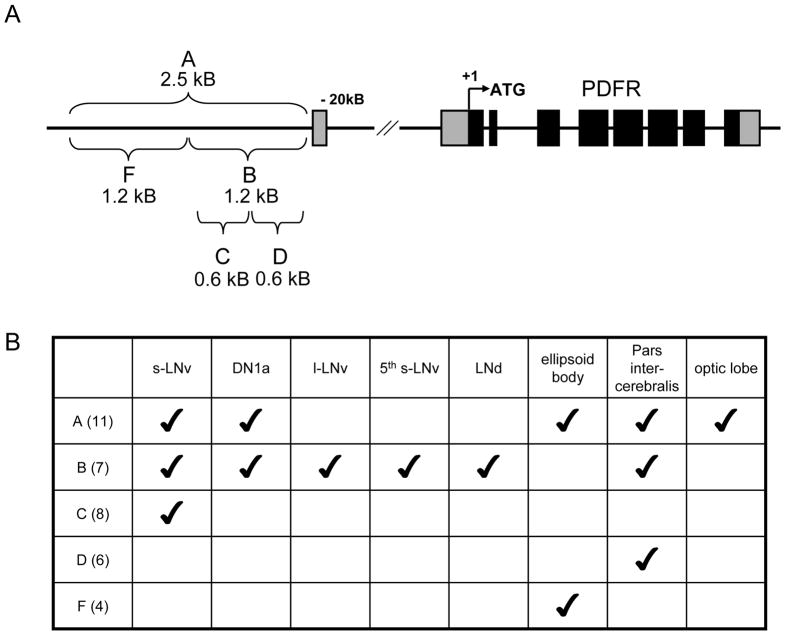
Figure 1. pdfr-GAL4 lines diagram and summary of expression patterns.
Five different pdfr-GAL4 constructs were created, all of which contain a portion of the promoter, upstream of the first exon. (A) Schematic drawing of captured promoter region in each GAL4 construct. (B) Summary table of expression patterns of each GAL4 construct. The first row lists brain regions examined for β–GALACTOSIDASE expression driven by GAL4 lines, whereas the first column lists five pdfr-GAL4 lines and number of independent transgenic fly lines examined for each construct.

