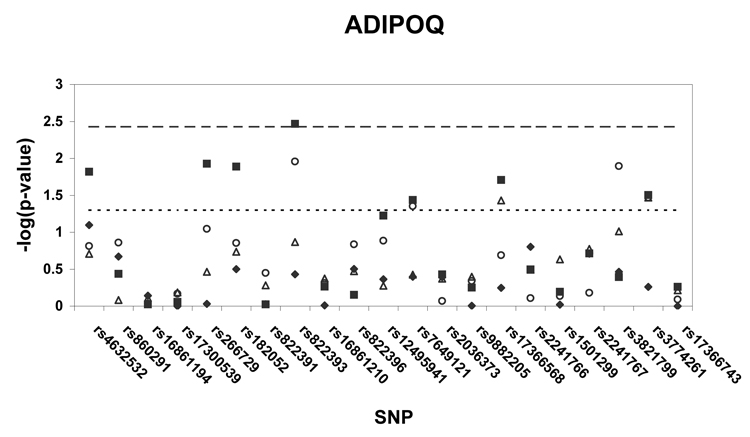
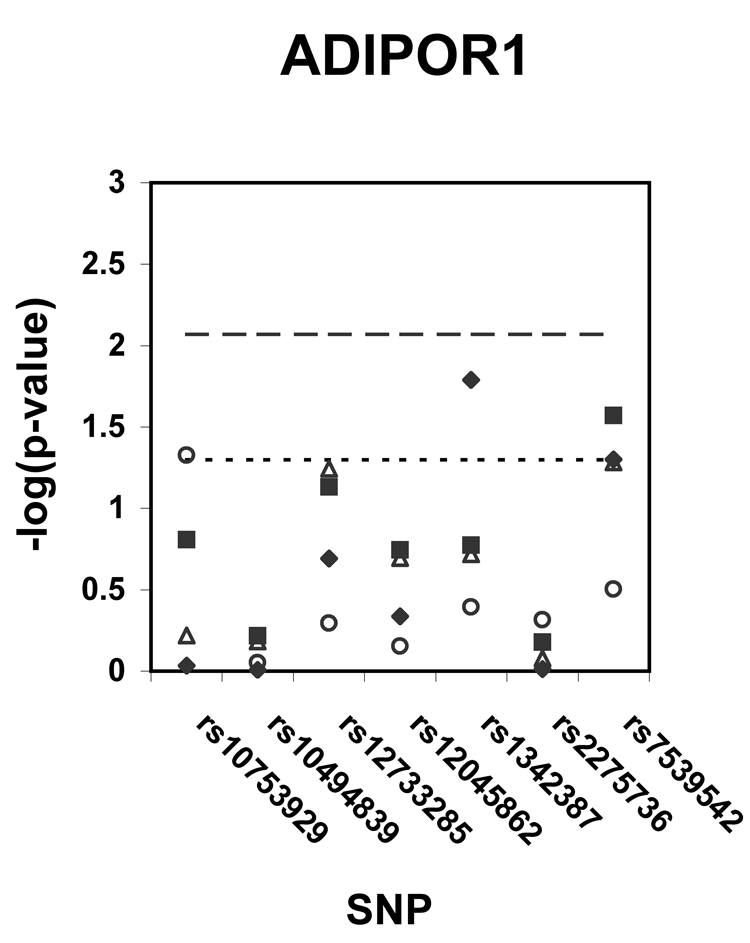
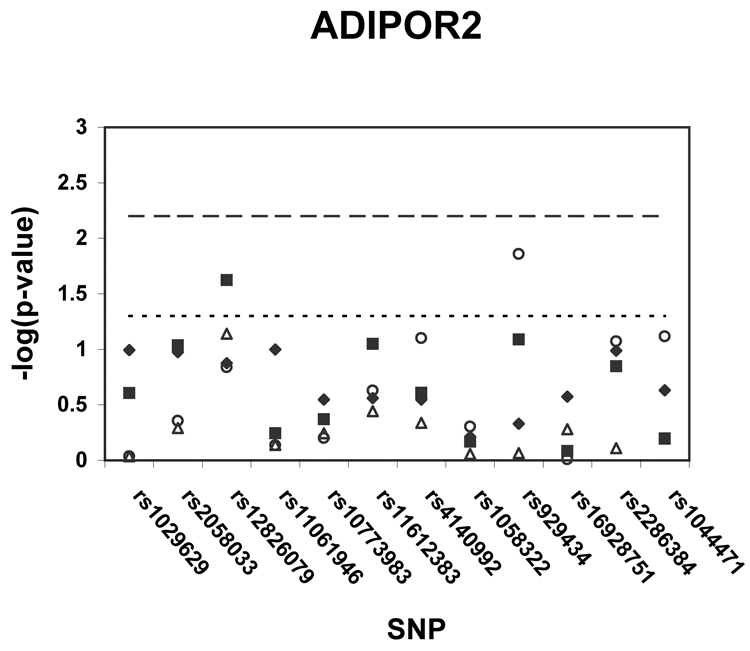
Figure 1. a–c. Association of tag SNPs in ADIPOQ, ADIPOR1, ADIPOR2 with insulin sensitivity.
All p-values are for regressions of insulin sensitivity on SNP genotype adjusted for age and sex. Black diamonds = African Americans, black squares = whites, white triangles = white probands and siblings, white circles = white parents. Points above the dashed line indicate p-values below the pre-specified significance threshold defined by SNPSpD (p < .0037 for ADIPOQ, p < .0085 for ADIPOR1, p < .0063 for ADIPOR2).Points above the dotted line indicate p-values below the threshold of p = .05. SNPs are listed in order of their appearance in the gene.


