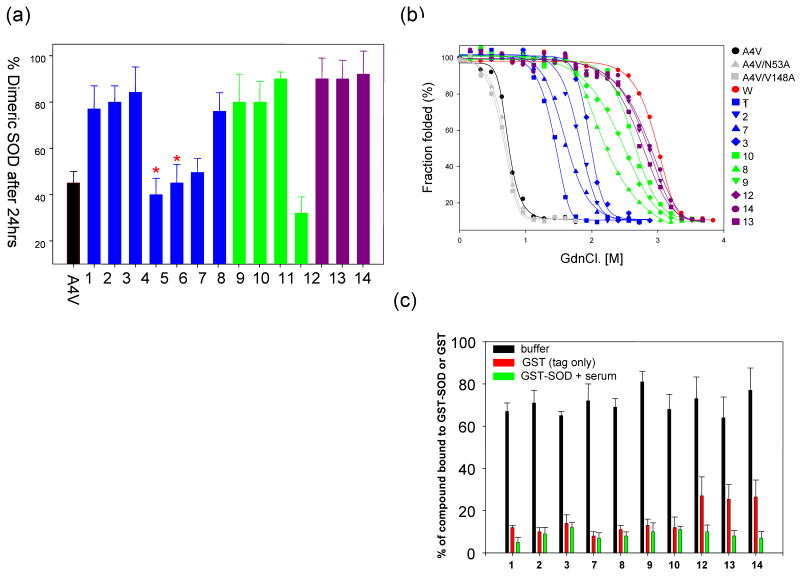
Figure 1.
(a) Aggregation of SOD-1A4V monitored using size-exclusion chromatography in presence of a series of compounds having either uracil or aza-uracil like substructures. The amount of dimer observed after 48hrs of incubation is plotted after normalization of the aggregation curves. Two molecules 4, 5 bear methylation at different positions on the aza-uracil ring and are indicated by (*) on top of the bar chart. (b) Unfolding of SOD-1A4V measured as a function of GdnCl. in presence of the small molecules tested in the left panel. The data have been fitted to a two-state model to facilitate the calculation of thermodynamics parameters shown in the table below (left). (c) Measurement of compound specificity towards a GST-SOD-1 fusion protein (green bars) in presence of buffer and blood plasma. Control experiments include binding in buffer (black bars) and GST (tag) alone (red bars).

