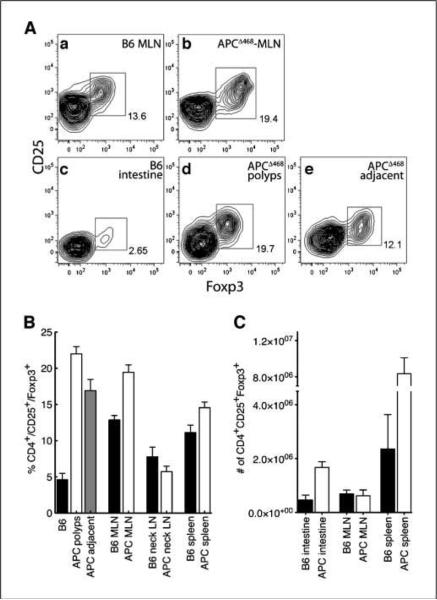
Figure 2.
Frequencies and numbers of CD4+CD25+Foxp3+ cells are elevated in APCΔ468 mice. A, contour fluorescence-activated cell sorting (FACS) plots of CD4+CD25+Foxp3+ cells prepared from the MLN of (a) control C57BL/6 and (b) age-matched APCΔ468 mice or intestine of (c) control C57BL/6 and (d) microdissected intestinal polyps of APCΔ468 mice or (e) tissue marginal to polyps of APCΔ468 mice. B, frequencies of CD4+CD25+Foxp3+ cells in C57BL/6 (black columns) and APCΔ468 (white columns) mice. Lymph nodes from the neck, spleen, and MLN were analyzed from healthy intestine (black columns), microdissected polyps (white columns), and tissue marginal to polyps (gray column). C, total numbers of CD4+CD25+Foxp3+ cells in the spleen, MLN, and intestine of control C57BL/6 (black columns) and APCΔ468 (white columns) mice. B6 mice (n = 7) and APCΔ468 mice (n = 11).

