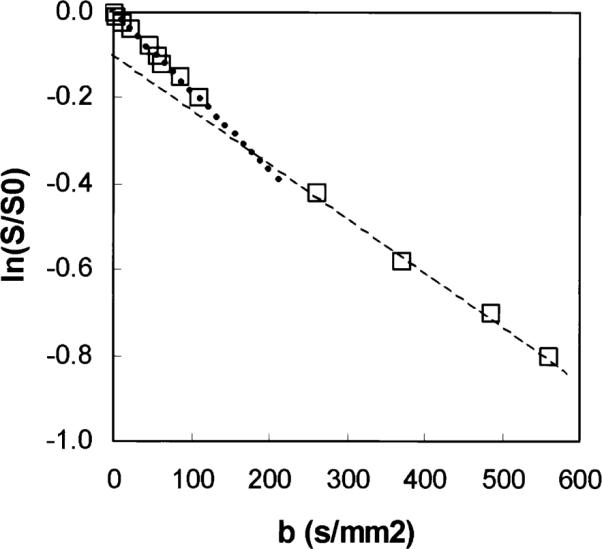
FIG. 5.

Normalized signal plotted as a function of diffusion weighting b for an ROI located in the anterior part of the myocardium, in log-linear scale. The open squares are the experimental data, and the dotted lines are the monoexponential fits for the lower (slope = Dfast) and higher (slope = D) b-values, respectively.
