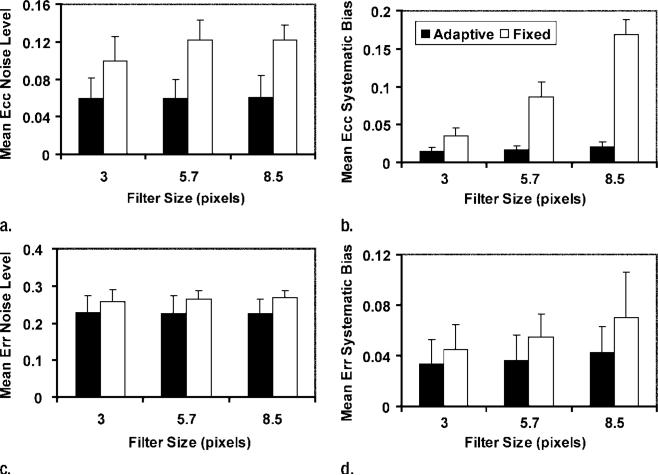
Figure 8.
Graphs show the effect of filters on noise levels, and systematic biases of strain maps are shown for three filter lengths. Mean and 95% confidence intervals (error bars) are shown for (a, b) Ecc and (c, d) Err. Filter types were compared with two-way analysis of variance, with filter length and type as the two factors. Adaptive filters (black bars) led to lower noise levels (a)(P < .001) and biases (b)(P < .001) in Ecc than did fixed filters (white bars). Adaptive filters also led to lower noise levels (c)(P < .001) and biases (d)(P = .029) in Err.

