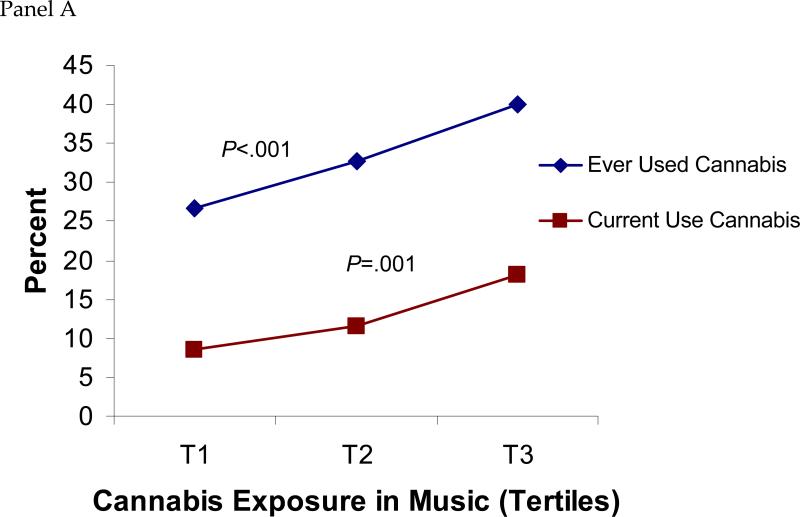
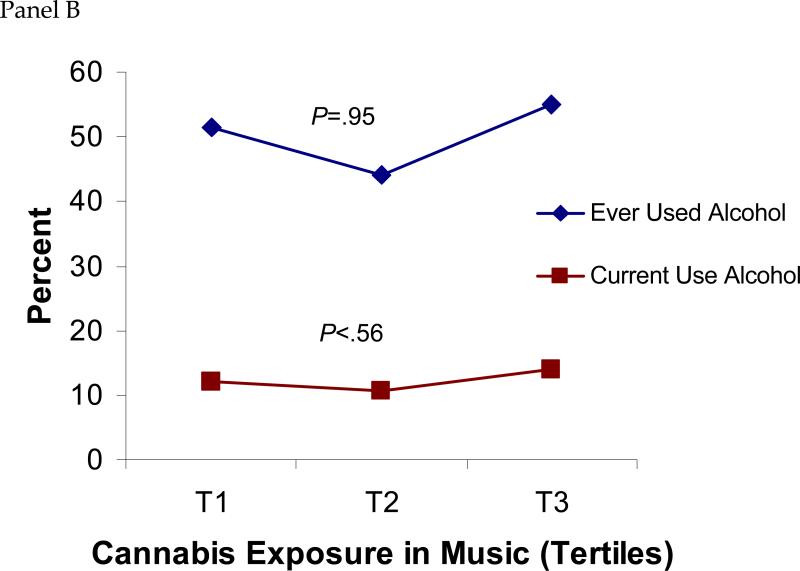
FIGURE 2.
These figures indicate the percentage of individuals with the indicated behavior when grouped according to exposure tertile, with T1 = Lowest tertile of exposure to cannabis in music; T2 = middle tertile; T3 = highest exposure. P-values refer to tests for trends based upon logistic regression analyses. Ever use of cannabis was defined as ever use, even a puff, during one's lifetime. Ever use of alcohol was defined as completion of at least one drink during one's lifetime. Current use referred to similar usage but in the past 30 days.


