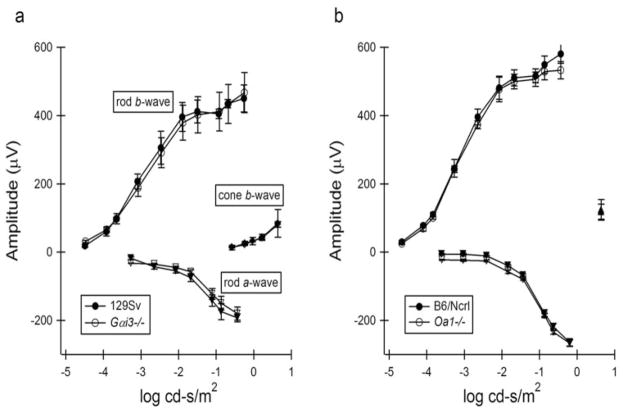
Figure 3.
Standardized electroretinography was performed in all experimental and control mice. Amplitudes and latencies of the photopic a-and b waves, flicker function, scotopic b waves, and dark-adapted maximum stimulation a- and b waves were measured. (a) Responses obtained from Gαi3−/− and control 129Sv mice. (b) Responses obtained from Oa1−/− and control B6/NCrl mice.

