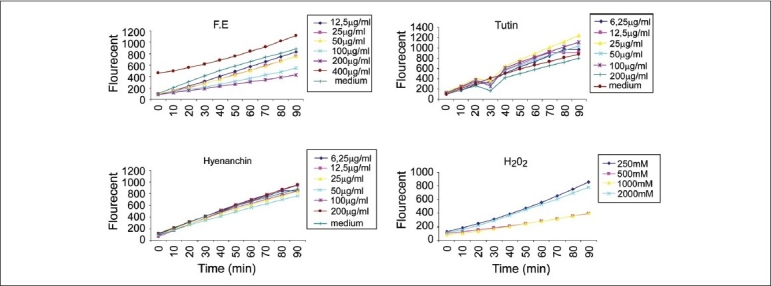
Figure 4.

Time-response curve of increase of DCF fluorescence in ‘HeLa cells’ after 90 minutes exposure to various concentrations of F. E (fruits, ethanol extract), tutin, and hyenanchin. Each data point represents the mean of data from three wells (n = 3)
