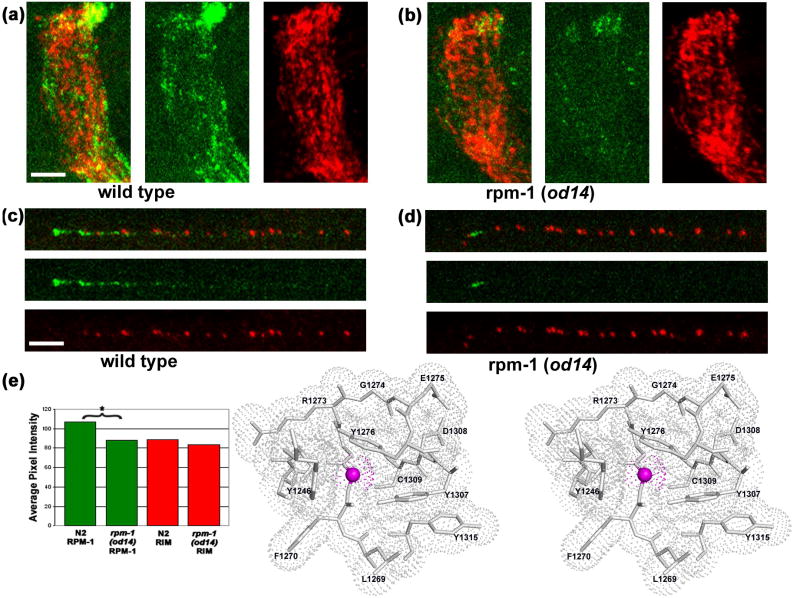
Fig. 4. Structural insights into the loss of function mutation.
(a, c) Wild type (N2) worms stained with anti-RPM-1 (green) and anti-RIM (red), a presynaptic active zone protein,43 show strong and punctate staining with each antibody. (a) Wild type nerve ring. (c) Wild type SAB neuron. (b, d) rpm-1(od14) animals show localization similar to that of wild type with a significant reduction in average RPM-1 signal intensity. (b) rpm-1(od14) nerve ring. (d) rpm-1(od14) SAB neuron. (e) Quantification27 of nerve ring staining intensity for RPM-1 (green) and RIM (red) in N2 and rpm-1(od14), * indicates a statistically significant difference (p<0.001). Scale bar 5μm. (f) Gly1271 of MmPHR1 is equivalent to residue Gly1092 of RPM-1, the C. elegans ortholog of mouse Phr-1. Surrounding residues are shown as atomic stick figures, with overlying van der Waals dot surface. The surface above Cα of Gly1271 is colored magenta.
Whole-mount staining was performed using a Finney-Ruvkun based protocol,44 with a borate buffer (pH 9.3) reduction step. Rat anti-RPM-1 antibodies were used at 1:300 (reference 27), Rabbit anti-RIM antibodies were used at 1:1000.43 Anti-rat Alexa 594 antibody was used with RPM-1 and anti-rabbit Cy5 was used with RIM. Both secondary antibodies were used at 1:1000. Images were acquired on a Zeiss LSM 5 Pascal confocal microscope as Z-stacks. Detector gain was tuned to minimize pixel saturation and maximize detection range. All images were acquired with exactly the same channel and detector settings for each genotype. Projections were made of the z-stack images using Zeiss Pascal software, exported as tif files and processed in parallel using Adobe Photoshop. For quantitative analyses the same size region (as shown) was used for each nerve ring intensity measurement. Average pixel intensity measurements were performed on each region for each channel using Metamorph (Molecular Devices Corporation, Chicago IL) n=9 for each genotype. Measurements were compared using a Welch Two Sample T-test performed in “R” (see The Foundation for Statistical Computing, http://www.R-project.org).

