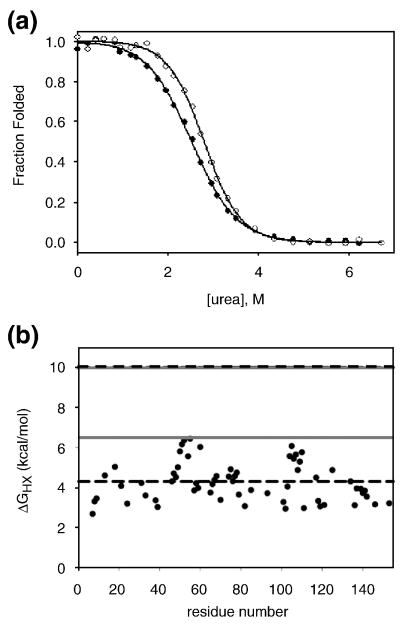
Figure 3.
I25A does not follow two-state behavior at equilibrium. a) Fraction folded of I25A by CD (closed circles) and fluorescence (open circles) determined from urea melts fit to a two-state approximation. Solid lines represent each fit. b) Hydrogen exchange data for I25A. The free energy of exchange of I25A is plotted as a function of residue. The grey solid lines represent the stability of WT and I25A by hydrogen exchange methods, as indicated, and the dashed black lines represent the stability of each protein calculated from the two-state fits to melts acquired in deuterated solvent.

