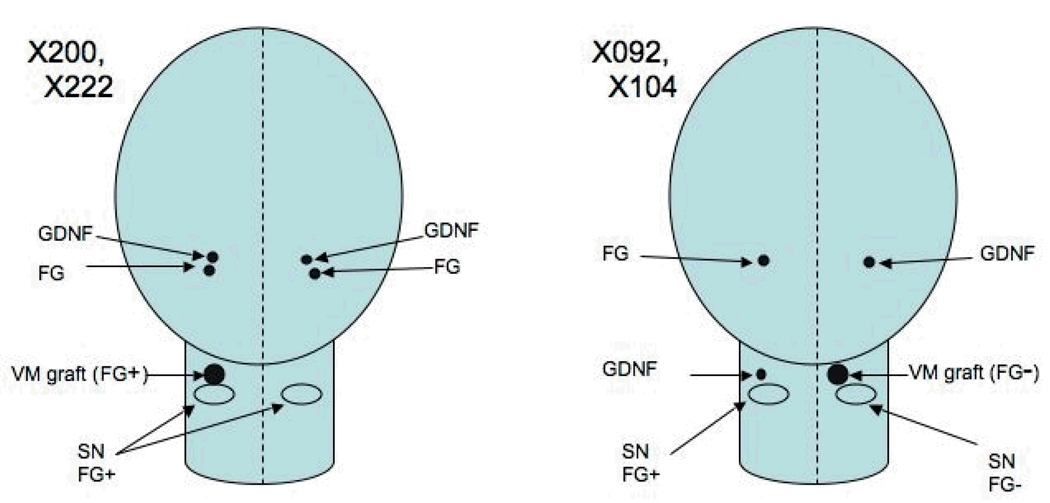
Figure 1.
The positions of graft, vector and retrograde tracer injection are illustrated schematically for Group 1 animals. The cerebrum is shown as an oval while the rostral brain stem is represented by a tube. In this and the following diagram the presence or absence of FluoroGold (FG) label is designated by plus or minus signs at the graft site. Rostral is to the top of the diagram in this dorsal view.

