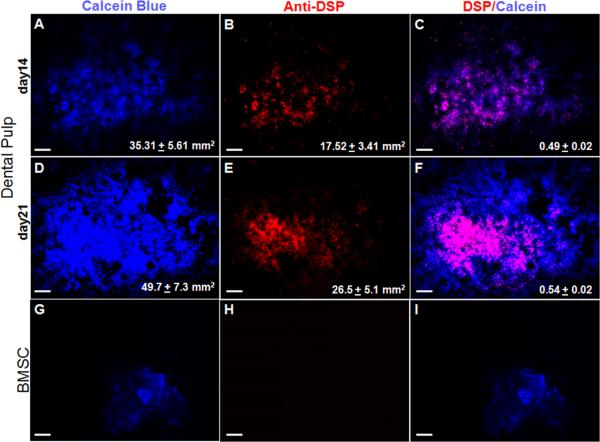
Figure 4. Quantification of the dentinogenic potential in the primary dental pulp culture.
Cultures from dental pulp (A-F) and BMSC (G-I) of P5-7 mice were stained with Calcein Blue (A, D, G) and anti-DSP antibody (B, E, H). Note that the expression of DSP in mineralized nodules in cultures from dental pulp (B, E), but not in BMSC (H). C, F and I represent overlay of the two images generated by AxioVision software. DSP expression is not detected in all the mineralized areas of the dental pulp cultures. Values in figures A and D represent mean ± SE of the total area of cultures stained with Calcein Blue. Values in B and E represent mean ± SE of the total area of cultures stained with anti-DSP antibody. Values in C and F represents the ratio of DSP+ area to Calcein Blue+ areas. Values are mean ± S.E from at least three independent experiments. Scale bar in all images = 1mm.

