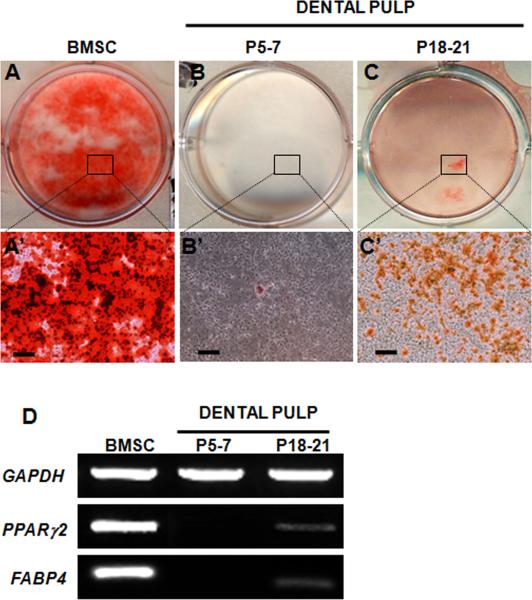
Figure 6. Adipogenic differentiation by cultures derived from dental pulp.
A-C represent images of representative cultures after 6 weeks from BMSC (A) and dental pulp from unerupted (P5-7) (B) and erupted (P18-21) molars (C) stained with Oil Red O. A’-C’ represent bright field images of the areas of cultures indicated in boxes showing lipid vacuoles stained with ORO. Scale bars in A’-C’= 100 μm.
(D) RT-PCR analysis of expression of FABP4 and PPARγ2, markers of adipogenesis in these cultures. Note the high levels of PPARγ2 and FABP4 expression in the BMSC cultures. Dental pulp cells derived from erupted (P18-P21) molars display low, but detectable levels of PPARγ2 and FABP4 expression. The expression of PPARγ2 and FABP4 is not detected in dental pulp cells derived from unerupted (P5-7) molars.

