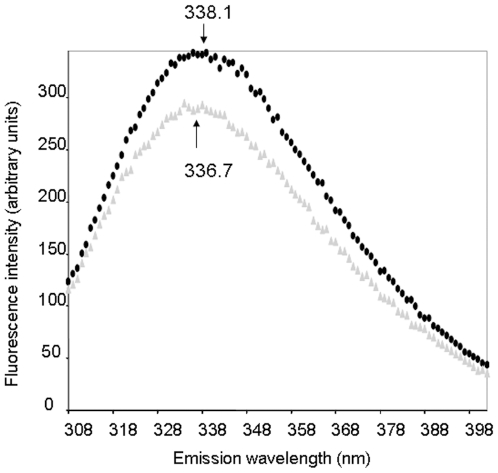
Figure 2. Fluorescence emission spectrum at 295 nm excitation wavelength of OAD in the absence (black circles) or presence (gray triangles) of 10 mM Oxomalonate.
Each spectrum is the average of at least three determinations. Samples were in 250 mM NaCl, 0.5% Tween 20, 0.05% Brij 58 50 mM, Tris-HCl, pH 7.4 buffer.

