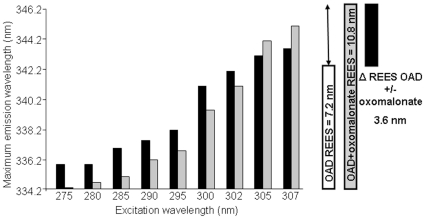
Figure 3. Red edge excitation shift observed as a result of oxomalonate binding to Oxaloacetate Decarboxylase.
Maximum wavelength of the emission spectra at different excitation wavelengths of OAD in the absence (black) or presence (gray) of 10 mM Oxomalonate. Each point is the average of at least three determinations. White and gray bars (right) correspond to OAD REES observed in the absence and in the presence of oxomalonate respectively. Samples were in 250 mM NaCl, 0.5% Tween 20, 0.05% Brij 58, 50 mM Tris-HCl, pH 7.4 buffer.

