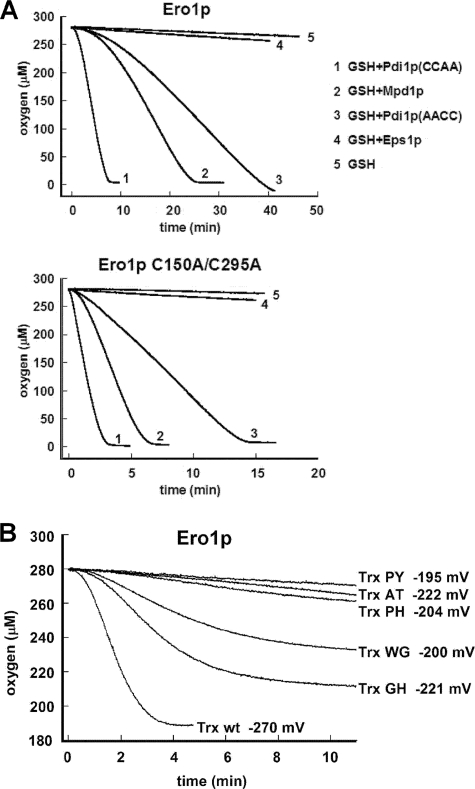
FIGURE 4.
Oxidation rates measured by oxygen consumption. A, reduced Pdi1p(CCAA), Pdi1p(AACC), Mpd1p, or Eps1p at an initial thiol concentration of 100 μm were mixed with 10 mm GSH. At time zero, Ero1p or Ero1p(C150A/C295A) was added to a concentration of 1 μm. Representative progress curves are shown, but in some experiments, oxidation of Mpd1p was slightly slower. Lag phases are evident in this experiment. B, oxidation of E. coli thioredoxin and mutant series. Reduced thioredoxin or active-site mutants (the two letters indicate the identity of the X-X amino acids in the Cys-X-X-Cys motif) at 200 μm thiol concentration were oxidized by 1 μm Ero1p.

