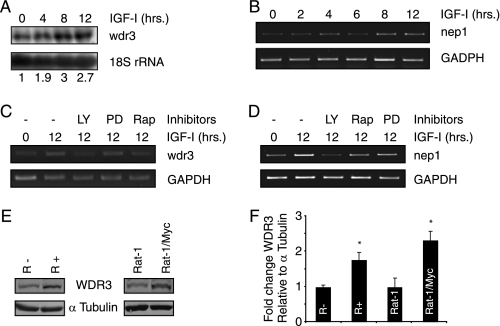
FIGURE 1.
IGF-I induces expression of WDR3 and NEP1 mRNA. A, MCF-7 cells were serum-starved for 12 h and stimulated with 100 ng/ml IGF-I for the indicated time. Total RNA was extracted, and Northern blot analysis was performed using probes specific for WDR3 and 18 S rRNA. Numerical values represent fold change WDR3 mRNA expression relative to 18 S rRNA and normalized to expression at time 0 h. Results represent one of two independent Northern blotting experiments with similar results. B, MCF-7 cells were serum-starved for 12 h and stimulated with 100 ng/ml IGF-I for the indicated times. Total RNA was extracted and analyzed by semi-quantitative RT-PCR using NEP1 and GAPDH primers. Results represent one of three independent experiments with similar results. C, MCF-7 cells were pre-treated with LY294002 (LY), rapamycin (Rap), and PD98059 (PD) for 30 min prior to IGF-I stimulation with 100 ng/ml IGF-I. Total RNA was extracted and analyzed by semi-quantitative RT-PCR using WDR3 and GAPDH primers. Results represent one of three independent experiments with similar results. D, MCF-7 cells were treated as in C. Total RNA was extracted and analyzed by semi-quantitative RT-PCR using NEP1 and GAPDH primers. Results represent one of three independent experiments with similar results. E, level of WDR3 protein was analyzed from protein lysates of R+, R−, Rat-1, and Rat-1/Myc cells by Western blot analysis using an antibody generated to detect WDR3. α-Tubulin was used as a loading control. Results represent one of five independent experiments with similar results. F, graph represents fold change WDR3 expression relative to α-tubulin normalized to levels in R− or Rat-1 cells from three similar experiments to that shown in E. *, p < 0.05, Student's t test.

