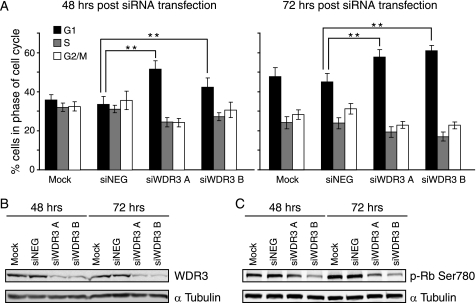
FIGURE 4.
Suppression of WDR3 results in an accumulation of cells in the G1 phase of the cell cycle. A, cell cycle profiles of MCF-7 cells that were mock-transfected, transfected with control siRNA, or siRNA targeting WDR3 were stained with propidium iodide. DNA content was analyzed by flow cytometry 48 h (left panel) and 72 h (right panel) post-transfection. Graphs indicate the percentages of cells in G1 (black), S (gray), and G2/M (white) phases of the cell cycle from triplicate samples for three separate experiments (**, p < 0.001, Student's t test). B, levels of WDR3 protein expression are shown with α-tubulin as a loading control. Results represent one of three independent experiments with similar results. C, phosphorylation of Rb at serine 780 was analyzed by Western blotting at 48 and 72 h post-transfection. α-Tubulin is shown as a loading control. Results represent one of three independent experiments with similar results.

