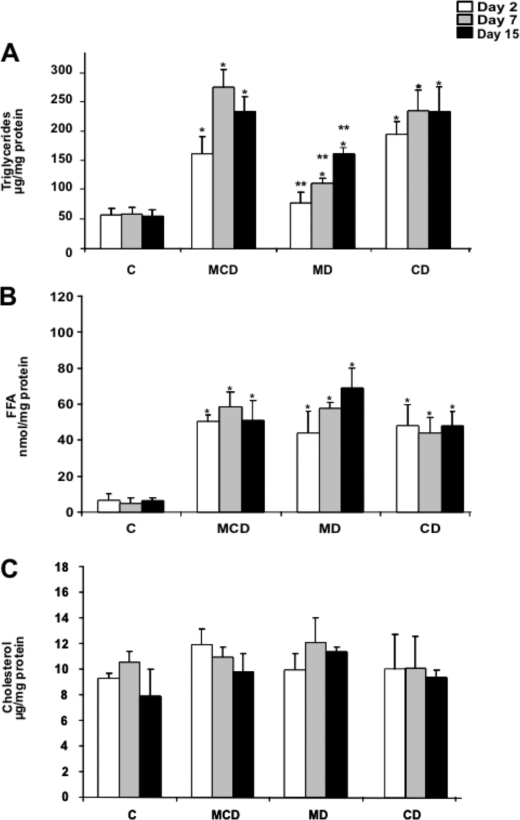
FIGURE 2.
Hepatic lipid profile of mice fed the MCD, MD, or CD diet. Liver samples from the different groups of mice were processed for the biochemical determination of TG (A), free fatty acids (B), or cholesterol (C). Results are the mean ± S.D. (error bars) of four to six individual mice. *, p < 0.05 versus control mice C; **, p < 0.05 versus MDC group.

