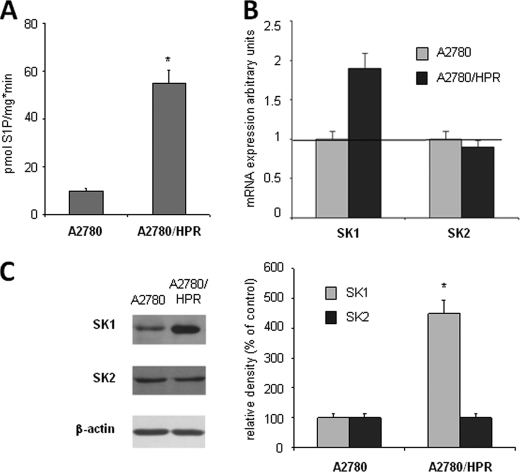
FIGURE 2.
SK activity and SK isoform expression in A2780 and A2780/HPR cells. A, A2780 and A2780/HPR cells were lysed, and cell extracts were employed for SK activity determination as described under “Experimental Procedures.” Data represent the mean ± S.D. of three independent experiments performed in duplicate. The difference between A2780 and A2780/HPR cells was statistically different by the Student's t test (*, p < 0.01). B, semi-quantitative PCR analysis of SK1 and SK2 mRNA expression levels was performed in A2780 and A2780/HPR cells by simultaneous amplification of the housekeeping gene β-actin. Data are normalized versus β-actin expression and utilizing individual SK isoforms of the A2780 specimen set as 1. Data are means ± S.D. of three independent experiments performed in triplicate. C, cell extracts from A2780 and A2780/HPR cells were employed for Western analysis using anti-SK1 and anti-SK2 antibodies. Left panel: a blot representative of three independent experiments is shown. Right panel: the histogram represents mean densitometric quantification (n = 3) of SK1 and SK2 versus β-actin, reported as a percentage relative to the intensity of the band corresponding to A2780 specimen set as 100. Statistical significance was determined by the Student's t test (*, p < 0.01).

