FIGURE 4.
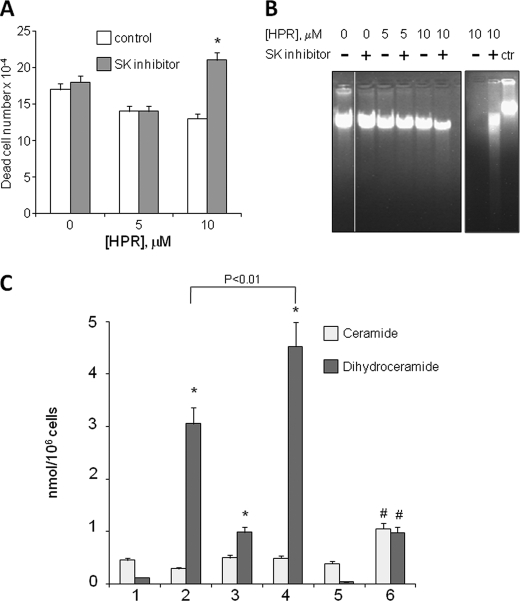
Effect of SK inhibition on HPR sensitivity and on ceramide and dihydroceramide production in A2780/HPR cells. 12 h after seeding, A2780/HPR cells were treated with SK inhibitor in the presence of different HPR concentrations and, after 96 h, the number of dead cells was evaluated by the Trypan blue exclusion assay (A, left). Data are the means ± S.D. of three different experiments. *, p < 0.01 versus controls. Non-fragmented (B, left) and fragmented DNA (B, right) was extracted as described under “Experimental Procedures.” The samples were analyzed by agarose gel electrophoresis and visualized by ethidium bromide staining (in B, right, genomic DNA was loaded on the same gel as control). C, MS analysis of ceramide and dihydroceramide content in A2780 cells resistant to HPR. Ceramide (light gray) and dihydroceramide (dark gray) content expressed as nanomoles/106 cells in 1, A2780/HPR control; 2, A2780/HPR plus HPR; 3, A2780/HPR plus SK inhibitor; 4, A2780/HPR plus HPR plus SK inhibitor; 5, SK1-overexpressing A2780; and 6, SK1-overexpressing A2780 plus HPR. Data are the means ± S.D. of three different experiments. *, p < 0.01 versus control cells. #, p < 0.025 versus SK1-overexpressing A2780.

