FIGURE 5.
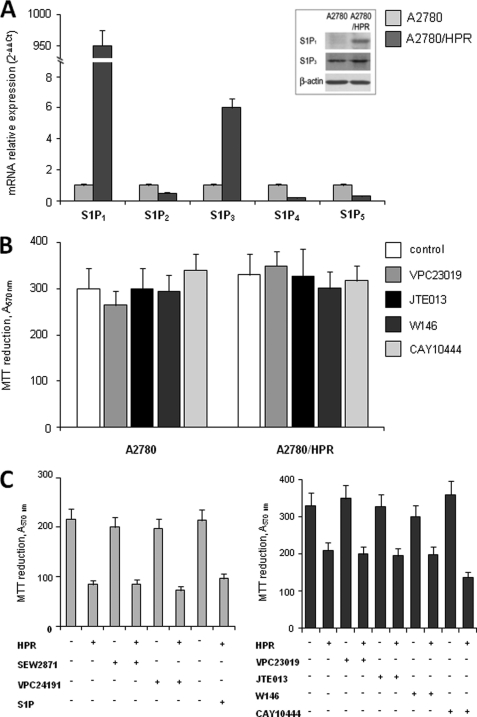
Expression and effect of agonists or antagonists of S1PRs on proliferation and HPR resistance in A2780 and A2780/HPR cells. A, quantitative real-time PCR analysis was performed in A2780 and A2780/HPR by simultaneous amplification of the target S1P1, S1P2, S1P3, S1P4, and S1P5 genes together with the housekeeping gene 18 S rRNA. The mRNA quantization was based on the comparative 2−ΔΔCt method, utilizing for each receptor its expression in A2780 cells as calibrator. Data are means ± S.D. of three independent experiments performed in triplicate. Inset: cell extracts from A2780 and A2780/HPR were employed for Western analysis using anti-S1P1 or anti-S1P3 antibodies. Equally loaded protein was checked by expression of β-actin. B, 12 h after seeding, A2780 and A2780/HPR cells were treated with different antagonists of S1PRs, and cell proliferation was evaluated after 96 h as mitochondrial metabolic activity measured by the MTT reduction assay. Data are the means ± S.D. of three different experiments. C, 12 h after seeding, A2780 cells were treated with different agonists of S1PRs alone or in the presence of 1 μm HPR (left panel), and A2780/HPR cells were treated with different antagonists of S1PRs alone or in the presence of 10 μm HPR (right panel); after 96 h, the mitochondrial metabolic activity was measured by the MTT reduction assay. Data are the means ± S.D. of three different experiments.

