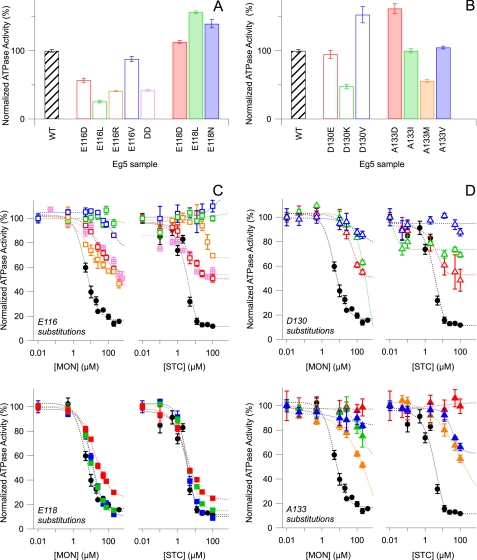
FIGURE 2.
Kinetic effects of N-terminal L5 residue substitutions are residue-dependent, but C-terminal L5 residue substitutions have no clear kinetic correlation. A and B, steady-state, basal ATP hydrolysis rates, for which mean Vmax for wild type (WT) (black) is 0.144 ± 0.003 s−1. For wild type, n = 101, whereas n for all substitutions ranges from 20 to 51. C and D, normalized Eg5 ATP hydrolysis rates were plotted against increasing concentrations of monastrol (left) or STC (right). WT kinetic data (black) are superimposed on Glu-116 (C, top), Glu-118 (C, bottom), Asp-130 (D, top), and Ala-133 mutants (D, bottom). The double mutant E116D/E118D (DD) data are shown in pink hatched boxes (C, top). All reactions contain 3–22.5 mm NaCl. Colors correspond to protein samples in A and B, respectively. ATP hydrolysis rates for each substitution are normalized with respect to the 0 mm monastrol or 0 mm STC measurements of the parent substitution. All data points in the figure reflect the averaged normalized rate from 2–4 separate protein preparations and the S.E. (error bars).

