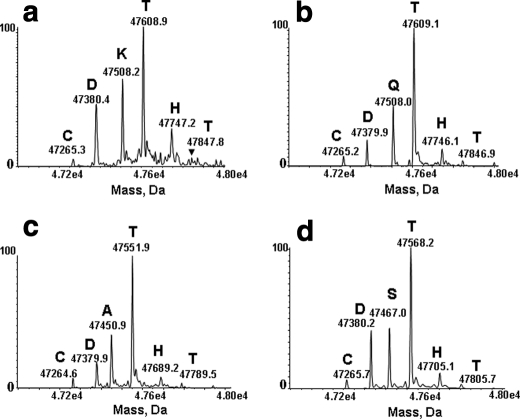
FIGURE 5.
RP-HPLC-TOF/MS analysis of the Fab fragment released from the native IgG1 and the variants. Shown are the deconvoluted spectra of the Fab domain from the native molecule (a), and K227Q (b), K227A (c), and K227S (d) variants. For clarity, each major peak was labeled with the mass and the corresponding single amino acid code of the ending residue.

