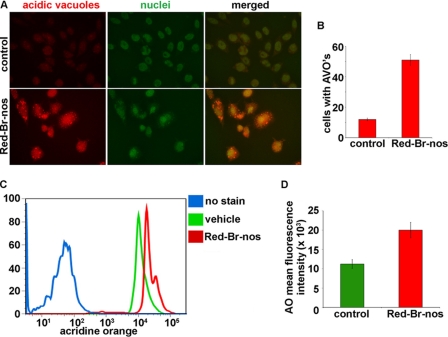
FIGURE 2.
Panel A, immunofluorescence microscopy of acridine orange-stained PC-3 cells treated for 24 h with DMSO (control) or 25 μm Red-Br-nos. Increase in number of cells with AO accumulating acidic vesicular organelles (orange-red fluorescence) in Red-Br-nos-treated cells was evident. Panel B, quantitation of cells with AVOs from 6 to 8 random image fields totaling ∼200 cells and reported as mean ± S.D. (p < 0.05). Panel C, histogram profiles of control and Red-Br-nos-treated cells that were read flow cytometrically. Blue profile shows unstained cells without AO as negative controls. Green profile depicts control cells that were stained with AO and the red profile shows drug-treated cells with increased AO fluorescence, indicative of numerous red AVOs. Panel D, bar graph representation of the quantitation of the mean fluorescence intensity in control and drug-treated PC-3 cells. Columns, mean ± S.D. (p < 0.05, compared with controls).

