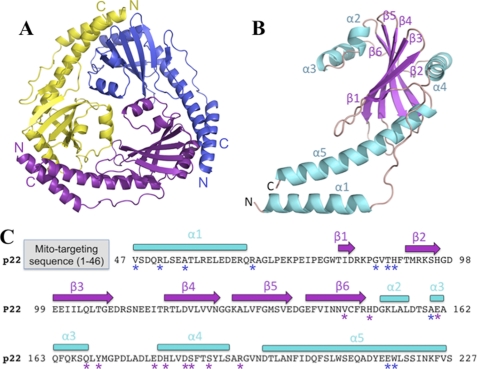
FIGURE 1.
p22 crystal structure. A, ribbon diagram of the p22 trimer. The different subunits are colored yellow, purple, and blue. The N and C termini of each subunit are indicated as N and C according to the color of the subunit, respectively. A and B and Figs. 2, 3, and 4 were made using PyMOL (20). The PDB code is 3JV1. B, ribbon diagram of the p22 monomer. The secondary structure elements are labeled and numbered. α-Helices and β-strands are colored cyan and magenta, respectively, whereas loops are colored salmon. The N and C termini are indicated as N and C, respectively. C, p22 sequence and secondary structure elements. The secondary structure elements of p22 are indicated above the sequence. α-Helices are shown as cyan rectangles and β-strands as magenta arrows. The location and length of mitochondrial signal sequence is indicated (gray). Residues that mediate trimer formation via hydrogen bonds are highlighted with asterisks (purple: subunit 1; blue: subunit 2).

