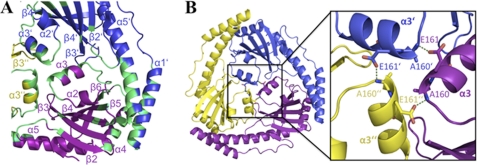
FIGURE 2.
Subunit interface of p22. A, regions involved in the p22 subunit interface. The different p22 subunits are colored as in Fig. 1A. The regions involved in the oligomer interface are colored green, and the secondary structural elements are labeled for reference. B, residues involved in the α3 interface or “α3-triangle.” The left panel shows the location of the α3-triangle in the p22 trimer. Inset (to the right) is a close-up view of the α3-triangle. Residues forming hydrogen bonds are indicated as sticks, and hydrogen bonds are shown as green dashed lines.

