FIGURE 4.
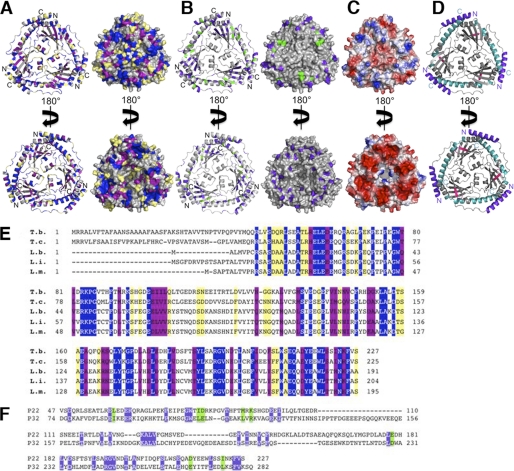
Conserved regions in p22. A, conserved residues among p22 proteins. Residues conserved in p22 proteins (T. brucei, T. cruzi, L. infantum, L. braziliensis, and L. major) are mapped in blue (fully conserved), purple (highly conserved), and yellow (minimally conserved) onto the T. brucei p22 ribbon diagram (left panel) and surface (right panel) in two different orientations (upper and lower panels). The non-conserved regions are colored gray. N and C termini are indicated on the ribbon diagrams. B, conserved residues in p22 and p32. Conserved residues in p22 and p32 are mapped in blue (fully conserved) and green (highly conserved) onto the T. brucei p22 ribbon diagram (left panel) and surface (right panel) in two different orientations (upper and lower panel). The non-conserved regions are shown in gray. N and C termini are indicated on the ribbon diagrams. C, electrostatic surface representation of p22 (taken from Fig. 3A). D, model for potential p22 interaction regions. The known protein interaction regions of p32 were mapped onto the p22 structure. The three main regions of p32 found to interact with other proteins are colored purple, cyan, and pink, respectively. E, sequence alignment of different p22 proteins. Residues conserved in p22 proteins (T. brucei: T. b., T. cruzi: T. c., L. infantum: L. i., L. braziliensis: L. b., and L. major: L. m.) are shown in blue (fully conserved), purple (highly conserved), and yellow (minimally conserved). F, structure-based sequence alignment of mature p22 and mature p32. Conserved residues in p22 and p32 are shown in blue (fully conserved) and green (highly conserved).

