
Figure 6. ERβ1 and EMT Regulate Snail1 Nuclear Localization.
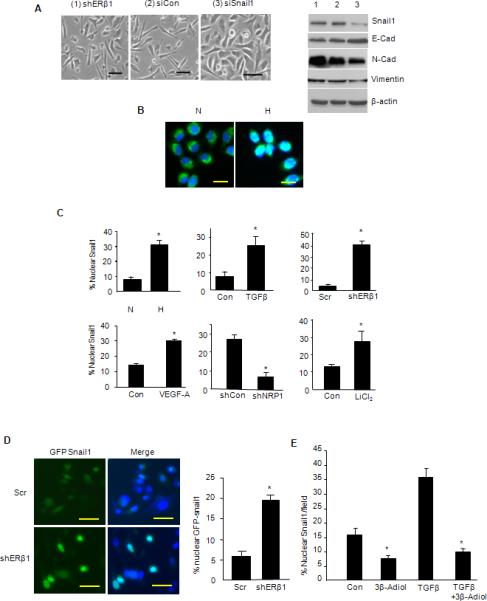
(A) PC3 cells that express an ERβ1 shRNA were transfected with either a control siRNA (siCon) or Snail1 siRNA (siSnail1), and analyzed for morphology and expression of EMT markers. (B) Snail1 was visualized by immunofluorescence microscopy in PC3 cells maintained in either normoxia (N) or hypoxia (H) for 48 hrs. The photomicrographs shown represent the merged images obtained from Snail1 staining (green; FITC) and nuclear staining (blue; DAPI). Note that in normoxia, Snail1 staining is predominantly cytoplasmic and excluded from nuclei. In hypoxia, however, Snail1 localization in nuclei is evidenced by ‘whitish-blue’ staining. (C) The percentage of nuclei that had Snail1 staining was quantified in PC3 cells maintained in normoxia (N) and hypoxia (H), and in cells stimulated with TGF-β or VEGF-A, as well as in PC3 cells in which ERβ1 or NRP1 expression was depleted by shRNA. Snail1 nuclear localization was also quantified in PC3 cells treated with LiCl2, a GSK-3β inhibitor. The data represent the mean of 3 separate experiments with SEM and P value (*) <0.05 indicated. (D) PC3 cells that express either a scrambled shRNA (Scr) or ERβ1 shRNA (shERβ1) were transfected with a GFP-Snail1 construct. GFP and DAP1 were visualized and the images merged. Note the nuclear localization of GFP-Snail1 as evidenced by the whitish blue staining that is associated with loss of ERβ1 expression. The bar graph represents the quantification of nuclear GFP-Snail1 from 3 independent experiments (±SEM) and P value (*) <0.05 indicated. (E) PC3 cells were treated with TGB-β in the absence or presence of 3β-Adiol (1 μM) and nuclear Snail1 was quantified. The data represent the mean of 3 separate experiments with SEM and P-value (*) <0.05 indicated.