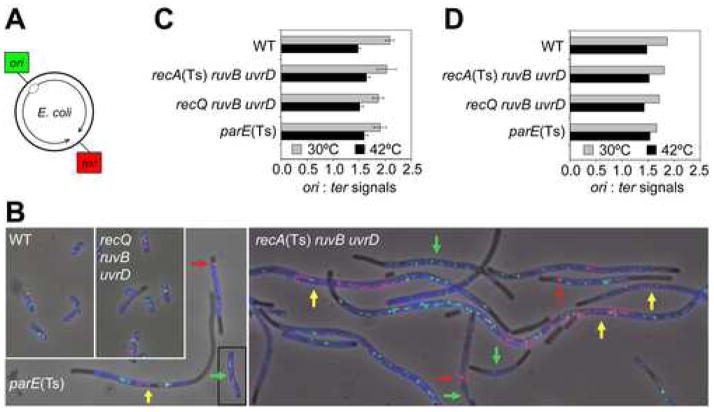
Figure 4.
Completion of Chromosome Replication During Defective Chromosome Segregation/Death of Δruv ΔuvrD Cells
(A) Chromosomal positions of ori and ter.
(B) Representative images of selected genotypes at 30°C using two-color FISH to loci shown in (A). Images are overlays of phase-contrast, DAPI (blue), green (ori-hybridization) and red (ter-hybridization) exposures. Common 42°C-grown [30°C for parE(Ts)] saturated cultures were diluted and grown to late-log phase at 30°C [42°C for parE(Ts)], at which each strain dies, prepared and analyzed. Colored arrows: yellow (“yellow class cells”), most ter signals near mid-cell with ori-signals near the cell poles; green, ori-only cells; red, ter signals clustered at one cell pole/to one side of a septum. Figure 5 for quantification of these classes.
(C, D) Completion of replication during chromosome-segregation failure in ΔruvB ΔuvrD recA(Ts) cells. Ratios of ori:ter signals per cell (means ± SEM) from--(C) normal and yellow-class cells (102–128 cells/genotype), and (D) all classes (104–144 cells/genotype). The ori:ter ratios do not differ between genotypes (p = 0.739 and 0.938 for 30°C and 42°C, Chi-squared analysis). All resemble wild-type [shown previously for control parE(Ts) cells (Khodursky et al., 2000)].

