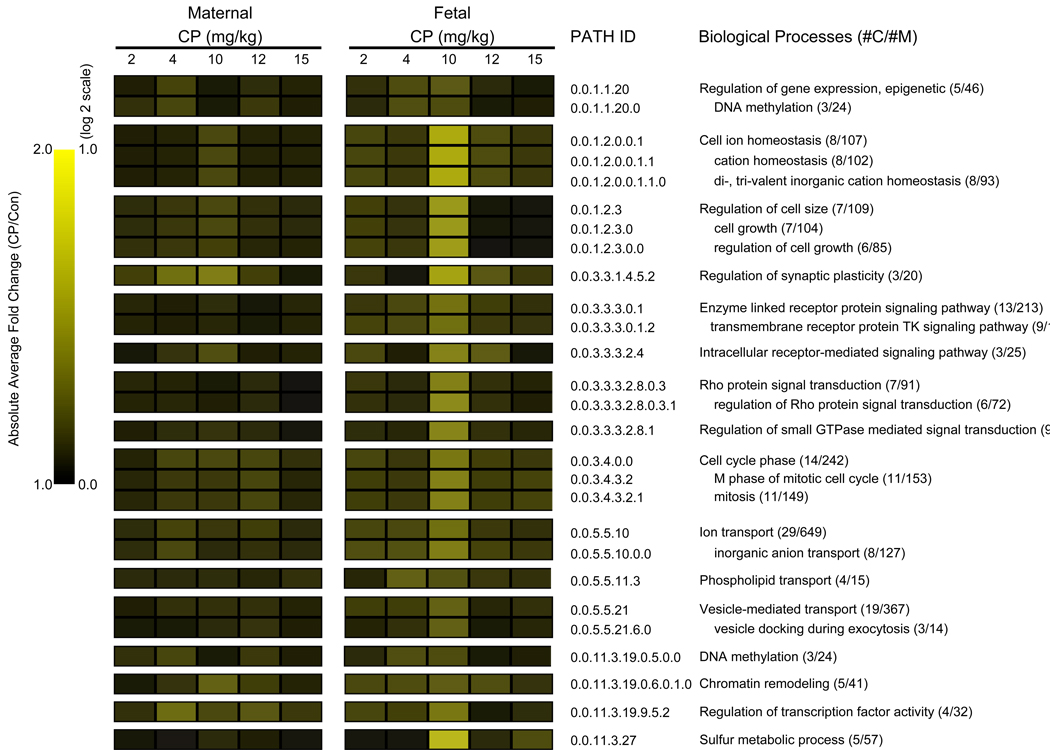
Fig. 7.
Quantitative analysis of GO biological processes found to be enriched within genes that showed differential expression pattern in the maternal and fetal brain across CP doses. MAPPFinder was used to link the gene expression data to the GO hierarchy and establish associations between treatment and the affected GO terms. The cut-off criteria for the GO analysis results were Z score ≥ 2.0, P ≤ 0.05 and at least 3 genes changed in each category. The heat-map shows the average absolute magnitude in change within enriched subsets of biological process categories, calculated by GO-Quant. #C: number of genes changed; #M: number of genes linked to each category that was detected in the array.

