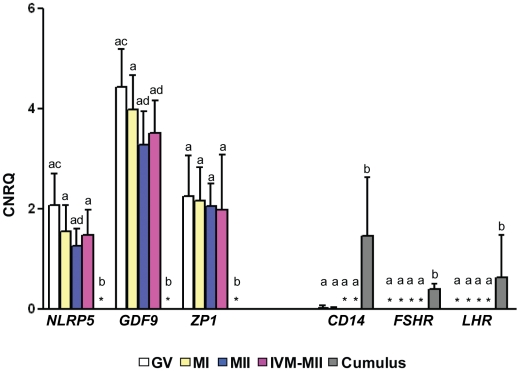
Figure 1. Expressions of oocyte-specific or cumulus cell-specific genes.
Values are the means of different stages of oocytes including GV (N = 10), MI (N = 8), MII (N = 9), IVM-MII (N = 10) and cumulus cells (N = 5). Error bars represent standard deviation (SD). CNRQ: calculated normalized relative quantity. *: Not detected in all samples. a,b or c,d: Values were significantly different (P<0.05).

