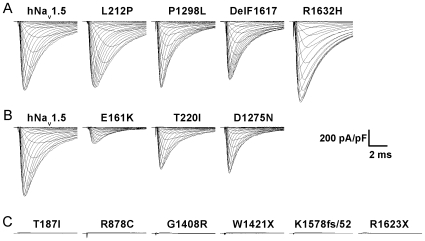
Figure 1. Representative HEK293 whole-cell current recordings for hNav1.5 and SSS-associated mutants.
(A) Group 1 mutants produced peak current densities similar to wild-type hNav1.5. (B) Group 2 mutants produced reduced currents. (C) Group 3 mutants produced no current. Table 1 shows average peak current densities and statistics thereof.

