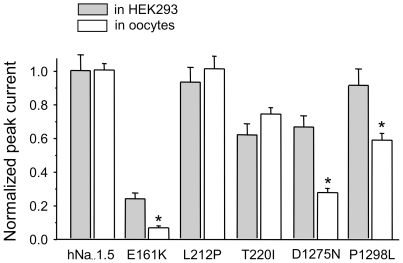
Figure 4. A comparison of normalized peak current amplitudes for wild-type and mutant hNav1.5 channels expressed by two different expression systems.
Whole-cell currents were recorded by the patch clamp technique (HEK293 cells) and by the two-microelectrode voltage clamp technique (oocytes) as described in “Methods”. L212P and T220I exhibited similar relative expression levels in both systems. With E161K, D1275N, and P1298L, whole-cell currents, normalized to hNav1.5 values, were significantly smaller for the oocyte system (* indicates p<0.01). Channels classified as group 3 mutants upon expression by HEK293 cells (T187I, R878C, G1408R, W1421X) did not produce detectable Na+ inward currents in the oocyte system, even upon injection of undiluted cRNA (data not shown).

