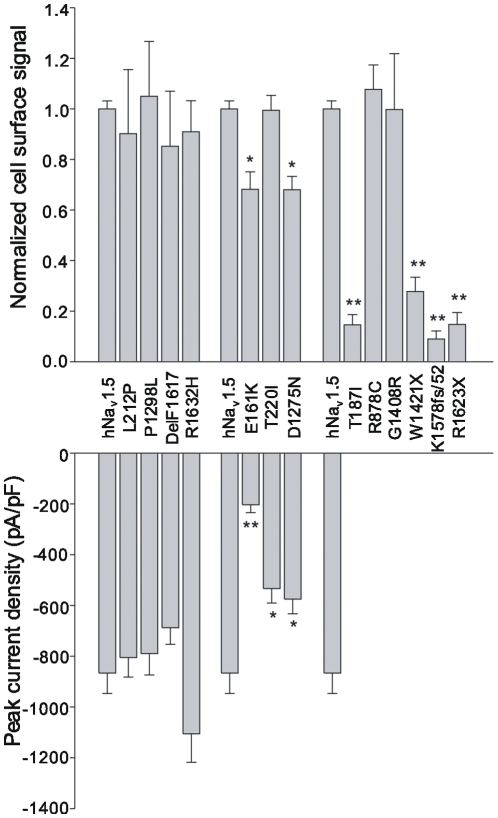
Figure 6. Correlation between cell surface expression and peak current densities for the thirteen SSS-associated mutant channels.
Normalized cell surface signals were obtained by dividing the “cell surface” signal by the corresponding “total” signal; both signals being obtained from the same Western blot (see Fig. 5). A ratio obtained for a mutant was further normalized by dividing with the ratio obtained for wild-type hNav1.5 again from the same blot. The mean double-normalized cell surface signals shown were calculated from at least three independent biotinylation experiments. * indicates p<0.05, ** indicates p<0.01.

