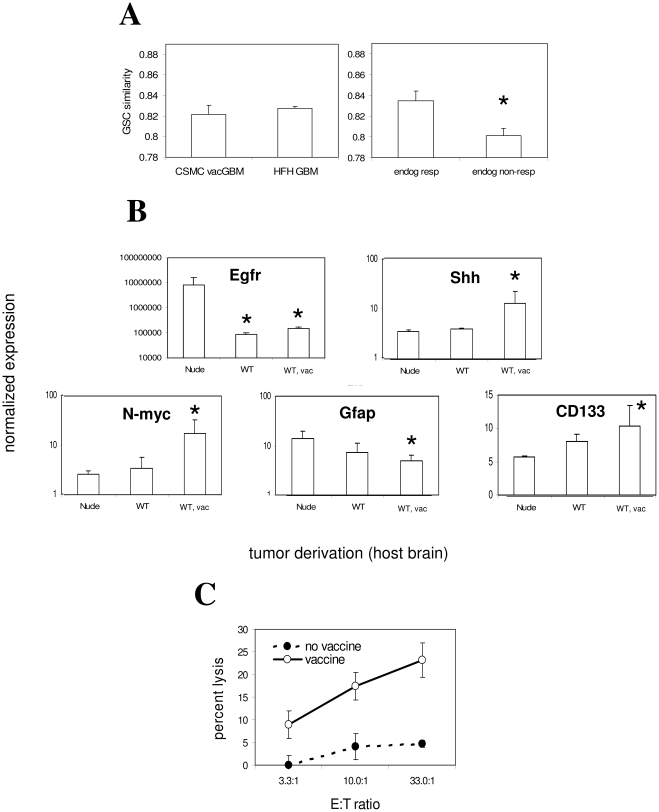
Figure 2. Regulation of stem-like gene expression in proportion to anti-tumor T cell activity.
(A) CSC similarity (Pearson's coefficient for similarity to GSCs – GEO accession #GDS2728 - across all transcripts) from 200 Henry Ford Hospital GBM patients (GEO accession #GSE4536) and 6 CSMC GBM patients was assessed and found to be statistically identical, demonstrating absence of relevant bias in CSMC patients (left panel). Division of CSMC patients according to median pre-vaccine anti-tumor response levels as described [23] revealed significantly lower GSC similarity in low anti-tumor responders (0.84±0.01 vs. 0.81±0.01; P<0.05, one-tailed T-test; n = 3 per group), and this levels was also significantly lower than average of HFH patients (P<0.04; one-tailed T-test). (B) Quantitative PCR was performed using primers to the indicated genes, and products quantified by SybrGreen on an iCycler system (BioRad, Hercules, CA). RNA was derived from 3 independent low-passage sublines per strain (3–5 passages after brain recovery). Asterisks denote significant difference in GAPDH-normalized expression of each of the indicated genes in WT or WT, vac-recovered relative to nude-recovered GL26 cells by ANOVA. Gli1 expression was also marginally but significantly increased in GL26B6V relative to GL26nu (not shown; 18.9% relative to GAPDH; P<0.002; two-tailed T-test). All reactions were performed in triplicate for each individual tumor subline (3 sublines per host type). (C) CTL responses of immunocompetent and vaccinated GL26-bearing mice. CTL activity of splenocytes from glioma hosts. CTL activity of ex vivo-stimulated splenocytes (7 days) from non-vaccinated and vaccinated symptomatic, intracranial GL26-bearing mice against cultured GL26 cells was assessed by tetrazolium assay, and plotted as GL26 lysis–spontaneous (effector + responder)lysis/total lysis. Raw values at higher E:T ratios were significantly higher those of the lowest E:T ratio in non-vaccinated controls (P<0.02 for 10:1, P<0.003 for 33:1 E:T ratios, respectively; ANOVA).

