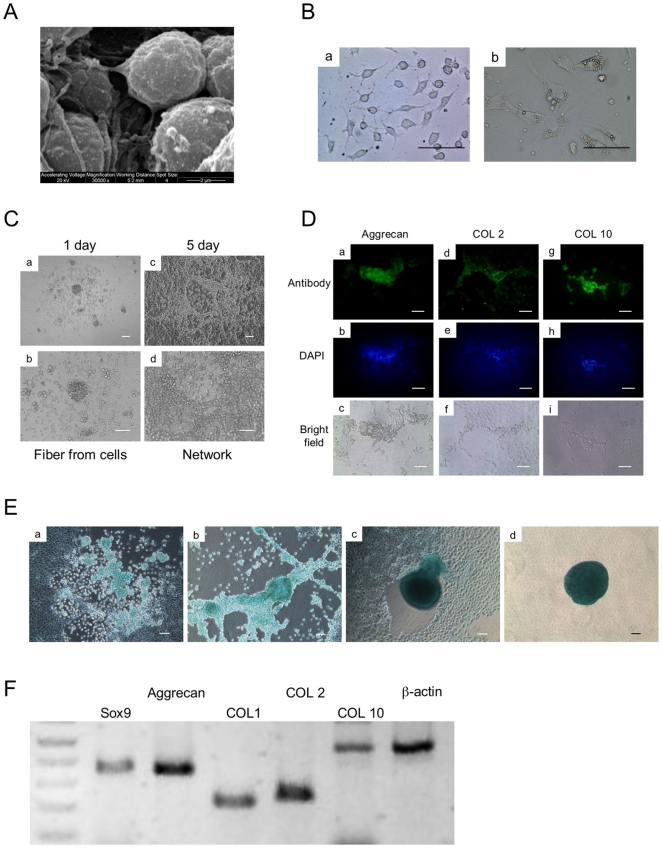
Figure 2. Chondrocyte differentiation.
(A) The ultra-structure of static suspension aggregate was analyzed by SEM at day 15. (B) The cells shed from aggregates displayed two types, round-shaped with fibrils (a) and flat fibroblastic cells (b). Scale bars represent 20 µm. (C) The round-shaped cells formed network spontaneously. Scale bars represent 50 µm. (D) The expression of chondrocyte-related proteins (Aggrecan, COL 2, COL 10) was analyzed at day 20 of differentiation by immunofluorescence (a, d, g), DAPI (b, e, h), Bright field (c, f, i). Scale bars represent 50 µm. (E) Alcian Blue stained chondrogenic cells at day 20 of differentiation (a, b). These cells were induced to form the aggregates spontaneously (c, d). Scale bars represent 50 µm. (F) The expression of chondrocyte-related mRNAs (Sox9, Aggrecan, COL 2, COL 10) and fibroblast-related mRNA (COL 1) were analyzed at day 20 by semi-quantitative RT-PCR. β-actin was used as a loading control.

