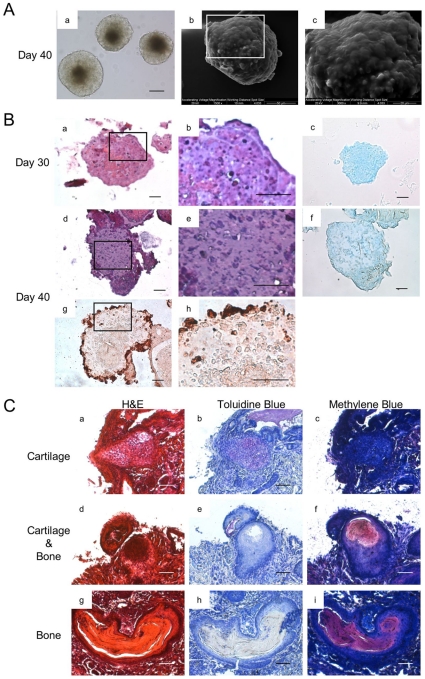
Figure 3. In vitro cartilage formation, and In vivo cartilage and bone formation.
(A) The morphology and ultra-structure of aggregate cultured at day 40. Morphology (a), Scale bars represent 100 µm. SEM (b, c) (B) The histological section of ESC chondrogenic aggregate cultured at day 30 and 40, H&E staining (a, d). Higher magnification (b, e). Alcian Blue (c, f). COL 2 (g, h). Scale bars represent 20 µm. (C) Transplantation of aggregates. Cells were cultured in vitro for 30 days under the chondrogenic differentiation protocol. The aggregates were then transplanted into SCID mice. After removal of transplanted tissue, both cartilage and bone tissues were observed. Cartilage was indicated by Toluidine Blue (b, e). Bone was indicated by Methylene Blue (f, i). Scale bars represent 50 µm.

