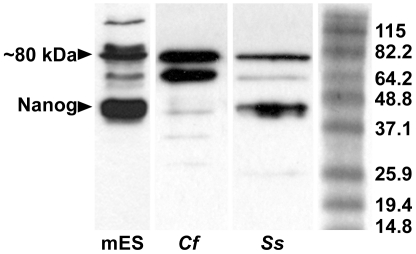
Figure 5. Immunoblot analysis.
Composite image of immunoblot results for NANOG on lysates of mouse ES cells and dog and pig testes. On the right is a Benchmark protein ladder (Invitrogen) and the indicated molecular weights for each band. Abbreviations: mES = mouse embryonic stem cells, Cf = Canis familiaris, Ss = Sus scrofa.

