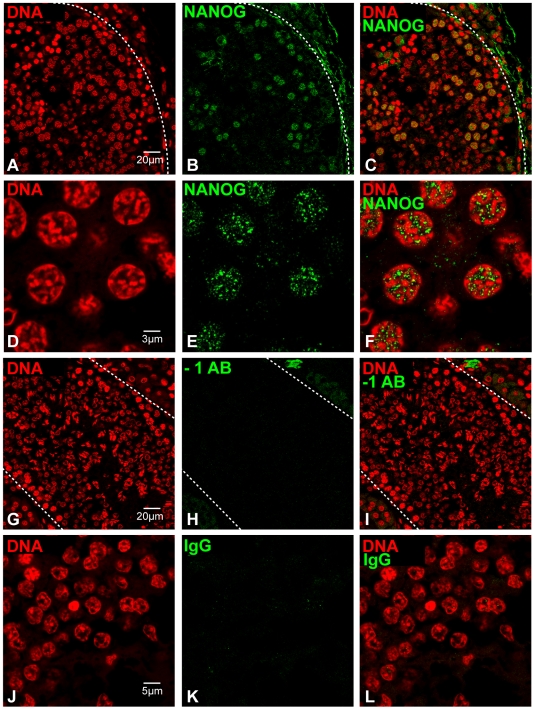
Figure 6. Expression of NANOG in pig testis as determined by immunofluorescence.
(A–C) NANOG expression in differentiating male germ cells; (D–F) high magnification image of NANOG expression in pachytene spermatocytes; (G–I) image of section in which the primary antibody was replaced by blocking solution, to control for non-specific binding of the secondary antibody; (J–K) representative high magnification image of testis section that was incubated with a rabbit IgG isotype control, to control for non-specific binding of the primary antibody. Dashed lines in panels A–C and G–I mark the boundaries of the tubules.

