
Figure 6.
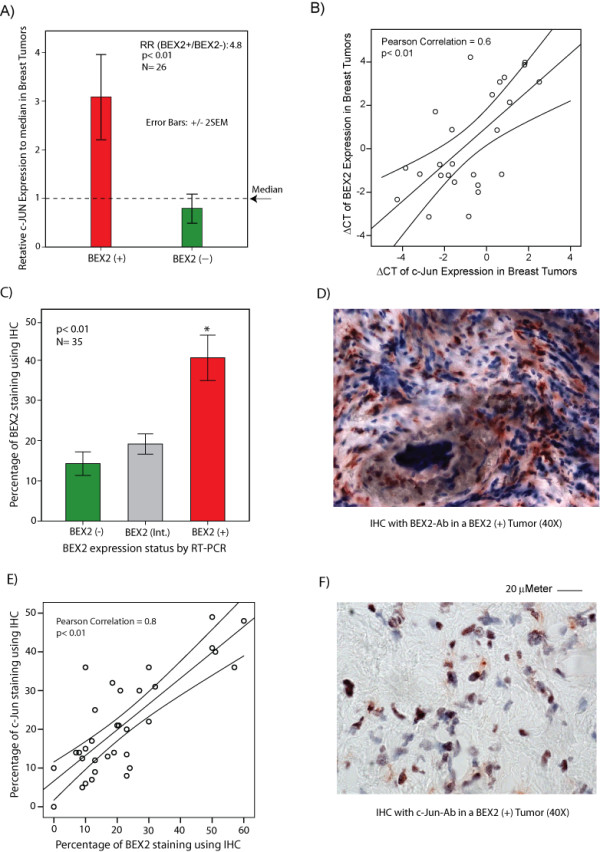
The correlation of BEX2 and c-Jun expression in primary breast tumors. (A) Relative c-Jun expression in BEX2 (+) and BEX2 (-) breast tumors using RT-PCR. RR: is relative c-Jun expression in BEX2(+)/BEX2(-). The expression differences between BEX2 over-expressed (BEX2 (+)) and BEX2 under-expressed (BEX2 (-)) samples are at least 3-fold. Error Bars: ± 2SEM. (B) Correlation between BEX2 and c-Jun gene expression. Scatter plot demonstrates the correlation of ΔCT values for BEX2 and c-Jun expression using RT-PCR in breast tumors. Correlation coefficient (0.6) is measured using Pearson's method. Linear regression line (best-fit) and 95% confidence interval lines are depicted (N = 26, p < 0.01). (C) BEX2 protein levels using immunohistochemistry (IHC). BEX2 staining was carried out using IHC with rabbit polyclonal BEX2 antibody at 1:50 dilution. Percentage of cells with BEX2 staining is compared between the following groups, which are previously defined by RT-PCR; BEX2 (+): ≥ 3-fold higher gene expression to median, BEX2 (-): ≥ 3-fold lower gene expression to median, and BEX2 (int.; intermediate): < 3-fold gene expression change to median. *, is for BEX2 (+) vs BEX2 (-) or BEX2 (Int.) groups. Error Bars: ± 2SEM. (D) BEX2 staining by IHC in a BEX2 (+) breast tumor at 40× magnification. (E) Correlation of BEX2 and c-Jun protein levels. Scatter plot demonstrates the correlation between the percentage of c-Jun and BEX2 staining using IHC in breast tumor samples. Rabbit c-Jun monoclonal antibody was used at 1:50 dilution. Correlation coefficient (0.8) is measured using Pearson's method. Linear regression line (best-fit) and 95% confidence interval lines are depicted (N = 35, p < 0.01). (F) c-Jun staining by IHC in a BEX2 (+) breast tumor at 40× magnification.