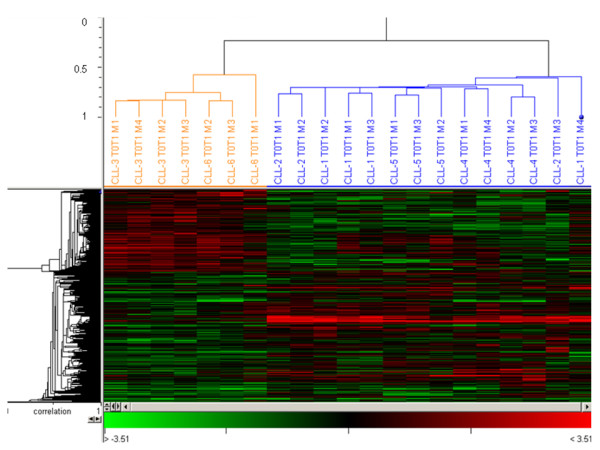
Figure 3.

Clusters of differentially expressed genes in CLL B-cells following treatment with fludarabine in vivo. A set of 532 genes were differentially expressed (DE) between CLL B cells of sensitive and resistant patients after 24 hours of treatment. Statistical analysis was performed by SAM 2-class analysis and significant DE genes were clustered using Acuity 4.0 (Pearson hierarchical clustering). Microarray replicates (M1 to M4) from sensitive and resistant patients are depicted in blue and orange, respectively.
